There are dozens of different marketing metrics today’s professionals and teams can use to enhance the performance of their campaigns.
However, to avoid being overwhelmed by data, digital marketers need to ensure they’re prioritizing the right metrics.
In this post, you’ll learn the most important digital marketing metrics and KPIs worth monitoring.
Top 20 Digital Marketing Metrics And KPIs
- Website Traffic
- Organic Visits
- Returning Visits
- Google Keyword Rankings
- Number of Backlinks
- Organic CTR (Click-Through-Rate)
- Conversion Rate
- Sales Pages Visits
- Bounce Rate
- Ads Impression View
- Ads Click-Through-Rate (CTR)
- Ads Cost-Per-Click (CPC)
- Ads Number of Conversions
- Ads Cost Per Conversion
- Social Media Followers
- Social Media Engagement Metrics
- Email Subscribers
- Email Open Rate
- Email Click-Through-Rate
- Customer Acquisition Cost (CAC)
1. Website Traffic
Website traffic is one of the most valuable marketing metrics. It provides insight into the number of users visiting your website over a specific time period.
Often, it can be used to gauge the effectiveness of your marketing campaigns to drive attention back to your site.
The more traffic your website receives, the more opportunities you’ll have to convert prospects into leads and customers.
Why this metric is important
The amount of traffic you get on your website directly impacts your ability to sell and grow. The more visitors you receive, the chances you’ll have to increase revenue.
However, it’s worth noting that not all website traffic is good traffic. The best visitors to your site will be targeted leads with a specific interest in your products and services.
That’s why it’s so important to consider the quality of your traffic, as well as the quantity.
How to measure it
The easiest way to measure website traffic is to tap into your insights on Google Analytics. All you need to do is add a Google Analytics tracking code to your website, and your Analytics profile will show you your number of visitors.
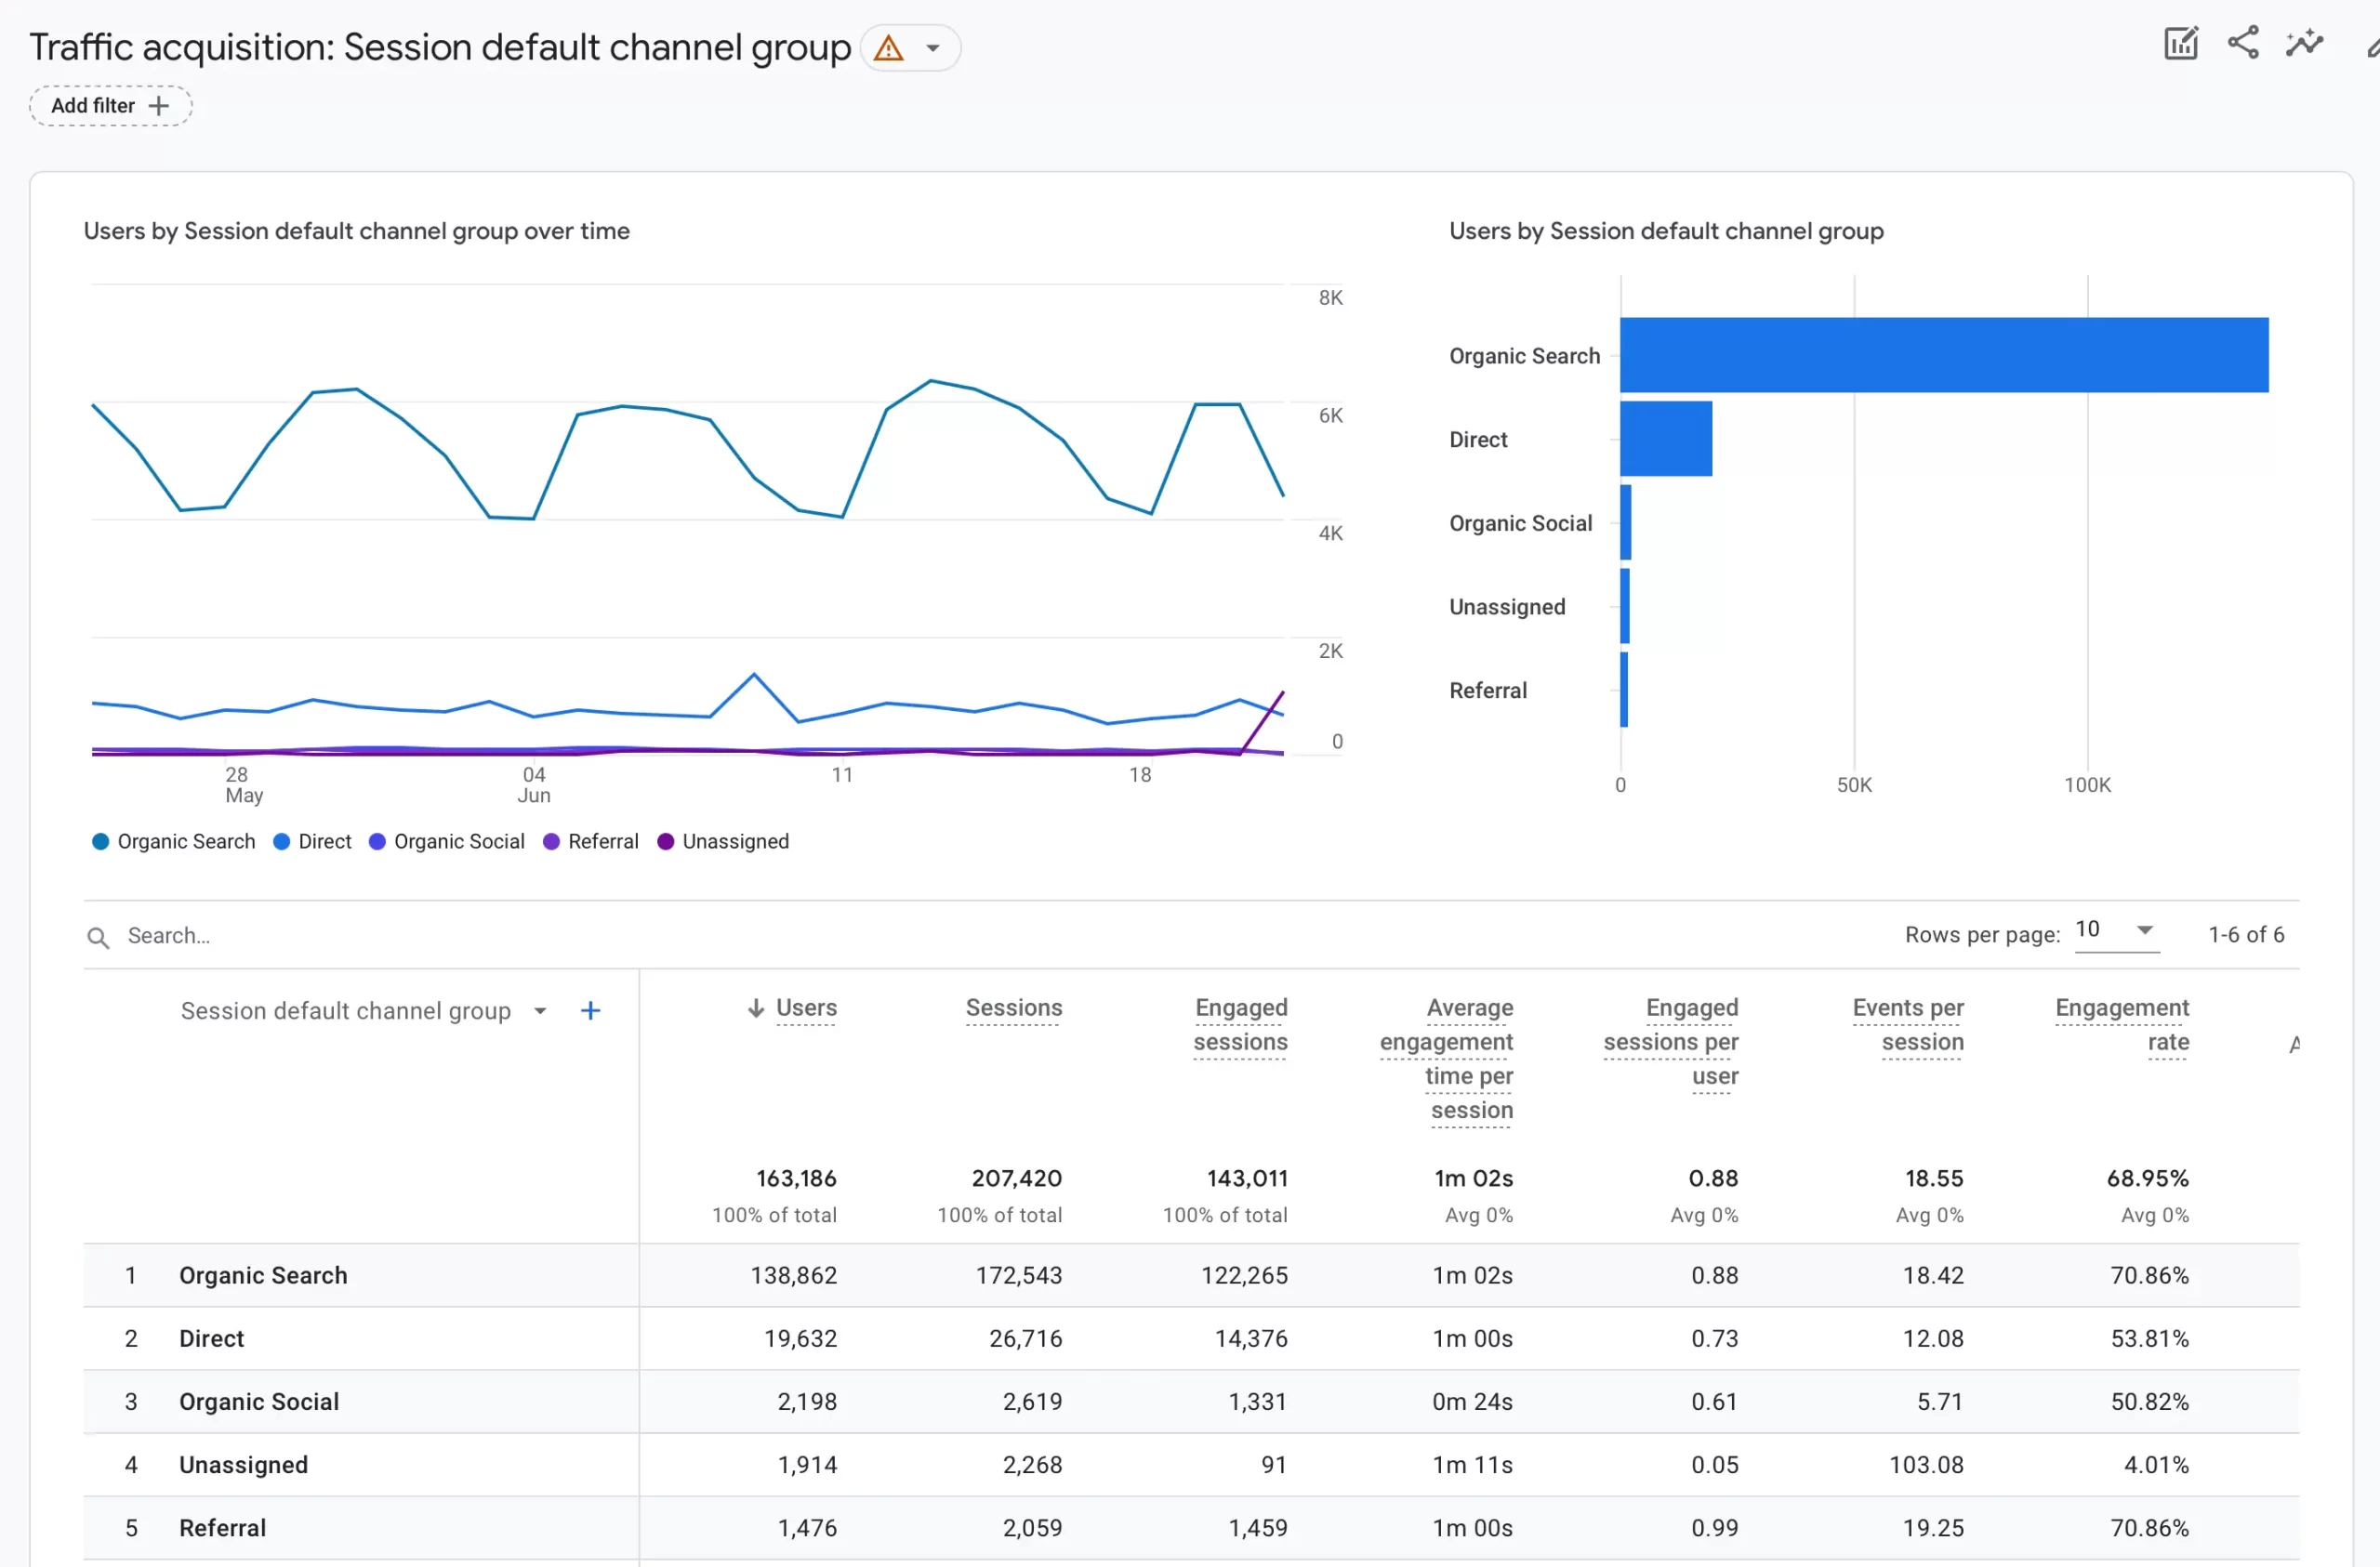
Google Analytics can also provide insights into where your customers come from, the links they click, and even which devices they’re using for browsing.
2. Organic Visits
Organic visits is a similar metric to website traffic in some ways. However, rather than focusing on all traffic, it focuses on the visitors your site receives from search engines.
Why this metric is important
Organic traffic tends to be more sustainable and valuable than paid traffic. It’s not reliant on advertising spend, as it relies on your ability to create engaging content to reach your audience.
The leads you receive from organic traffic may also be more likely to trust your brand.
Increasing organic traffic is often the core purpose of SEO (Search Engine Optimization). If your SEO strategies are effective, your number of organic visitors should grow.
If your organic visitor numbers drop, this could be a sign you’re not targeting the right keywords, using effective backlinks, or managing technical SEO correctly.
How to measure it
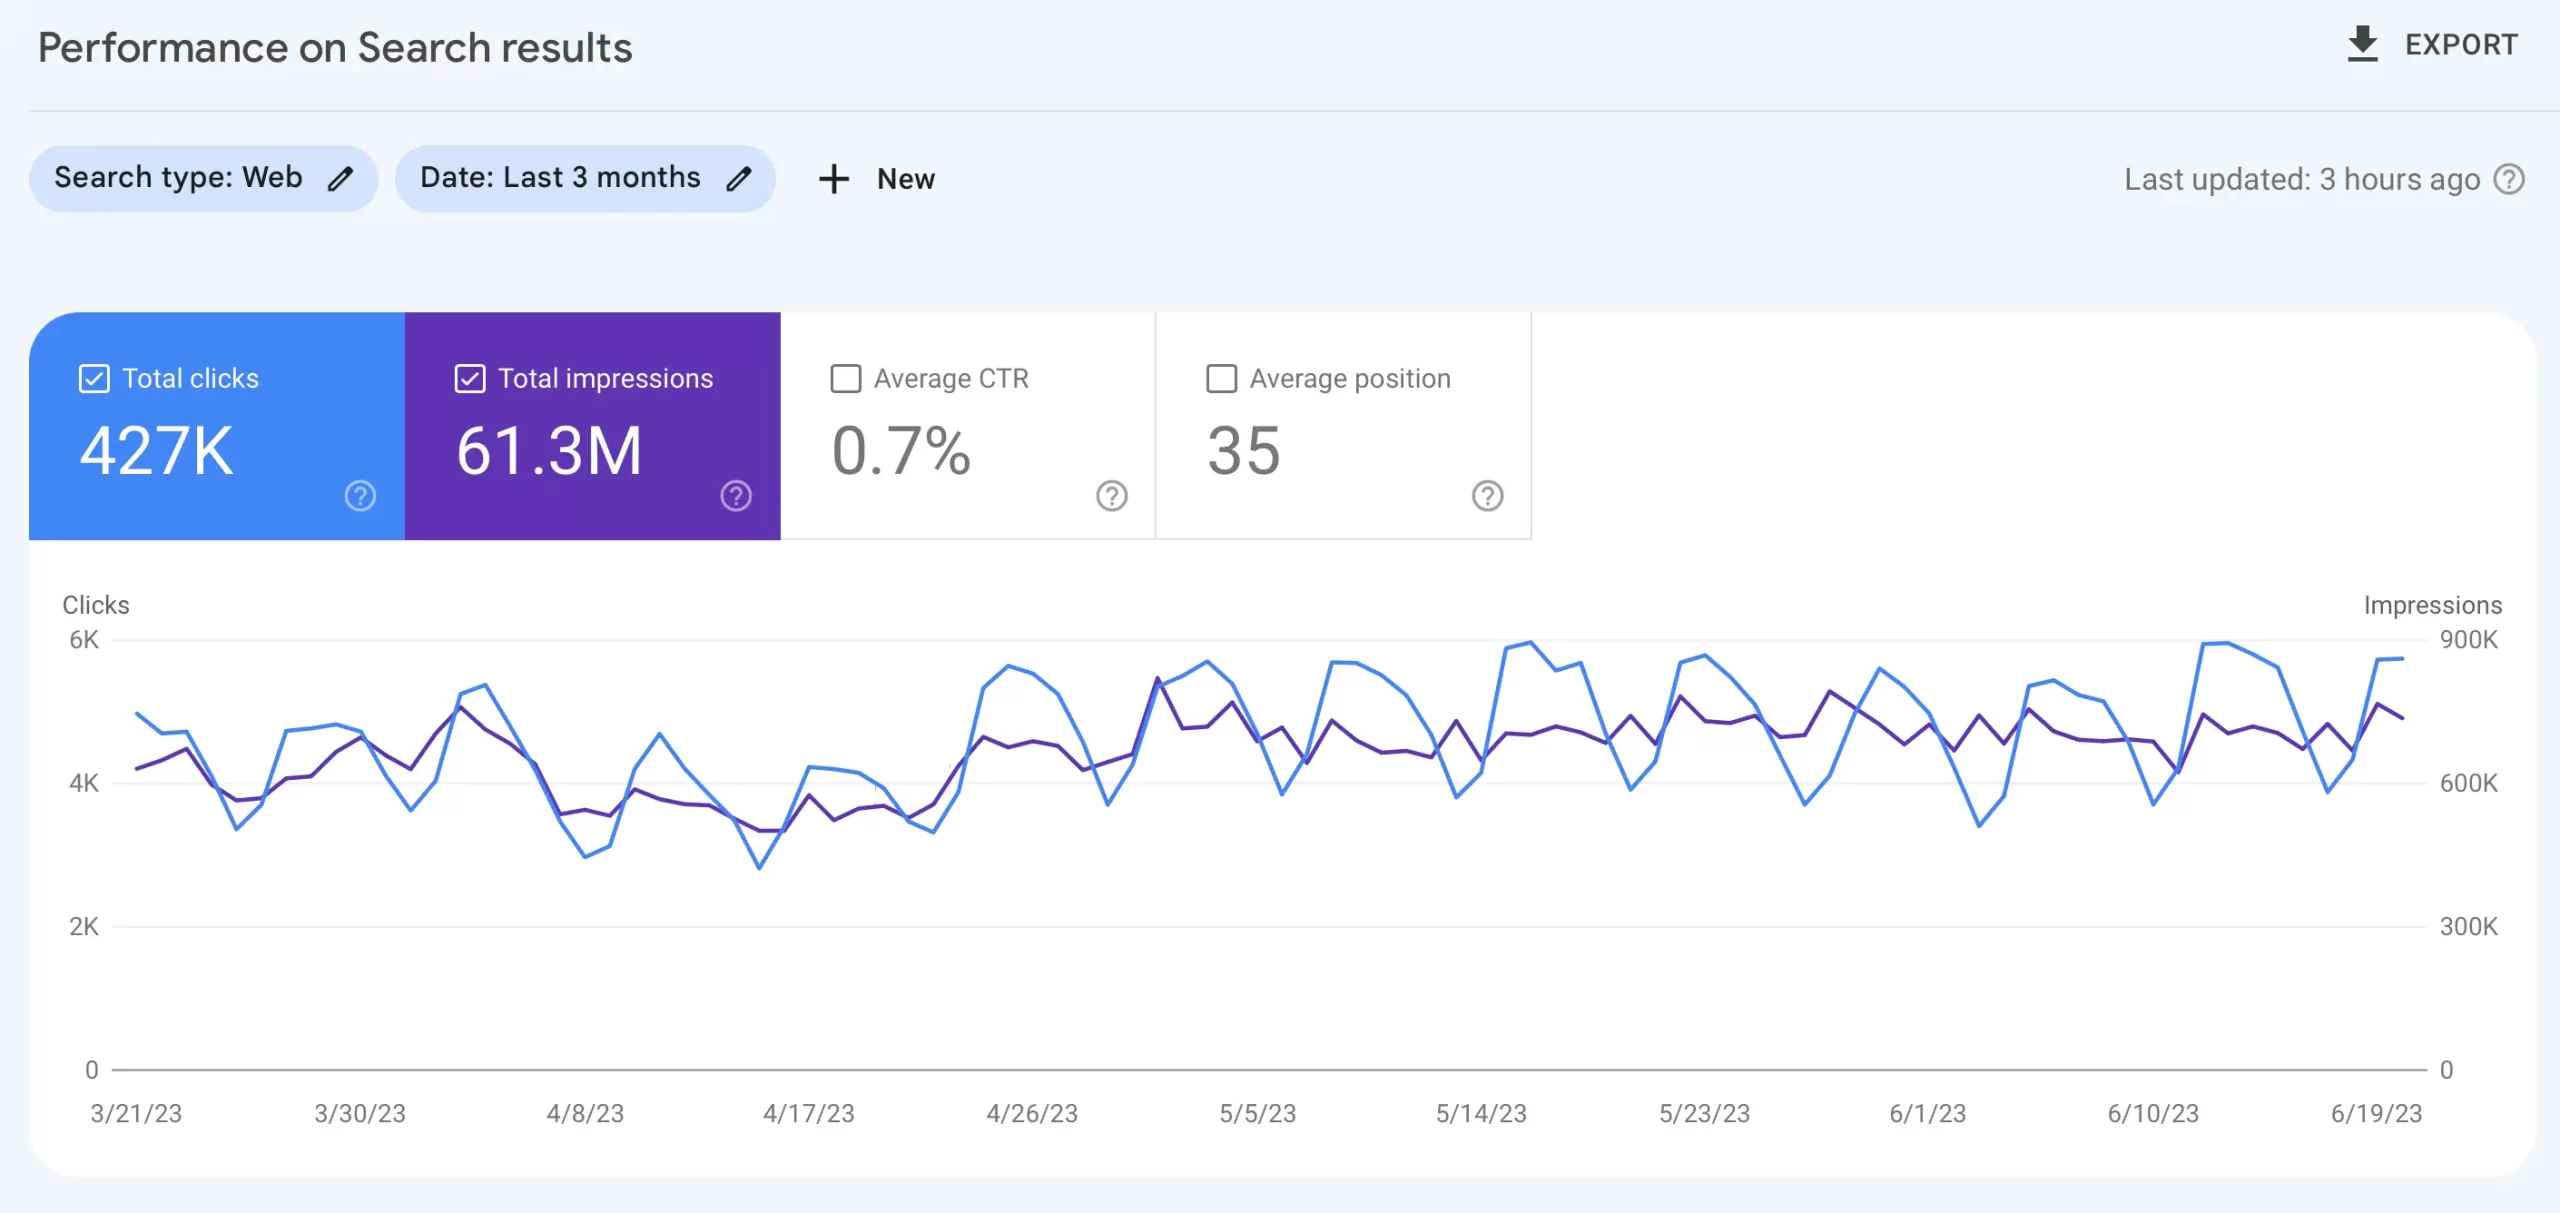
There are different ways to measure organic traffic. One of the most reliable ways is to view the Search Results Report on Google Search Console or the Search Performance Report on Bing Webmaster Tools.
Google Analytics can provide insights into your organic traffic numbers.
You can also consider using more advanced tools like Ahrefs or SEMRush to compare your organic traffic numbers to competitors or even find the exact keywords your competitors are targeting in their organic campaigns.
3. Returning Visits
Monitoring returning visitors means tracking the number of customers returning to your website after visiting it for the first time.
While it’s important to attract plenty of new visitors with the right campaigns, return visitors can be a lot more valuable.
Why this metric is important
Return visitors can be extremely valuable on any website. They show a higher level of engagement and brand trust than the average new visitor.
They’re also more likely to convert into paying customers.
Tracking the behavior of your returning visitors can help you to define which types of content or which pages inspire the most loyalty from customers.
The ratio of new visitors to returning visitors on your site can also highlight the success of your website’s inbound marketing.
How to measure it
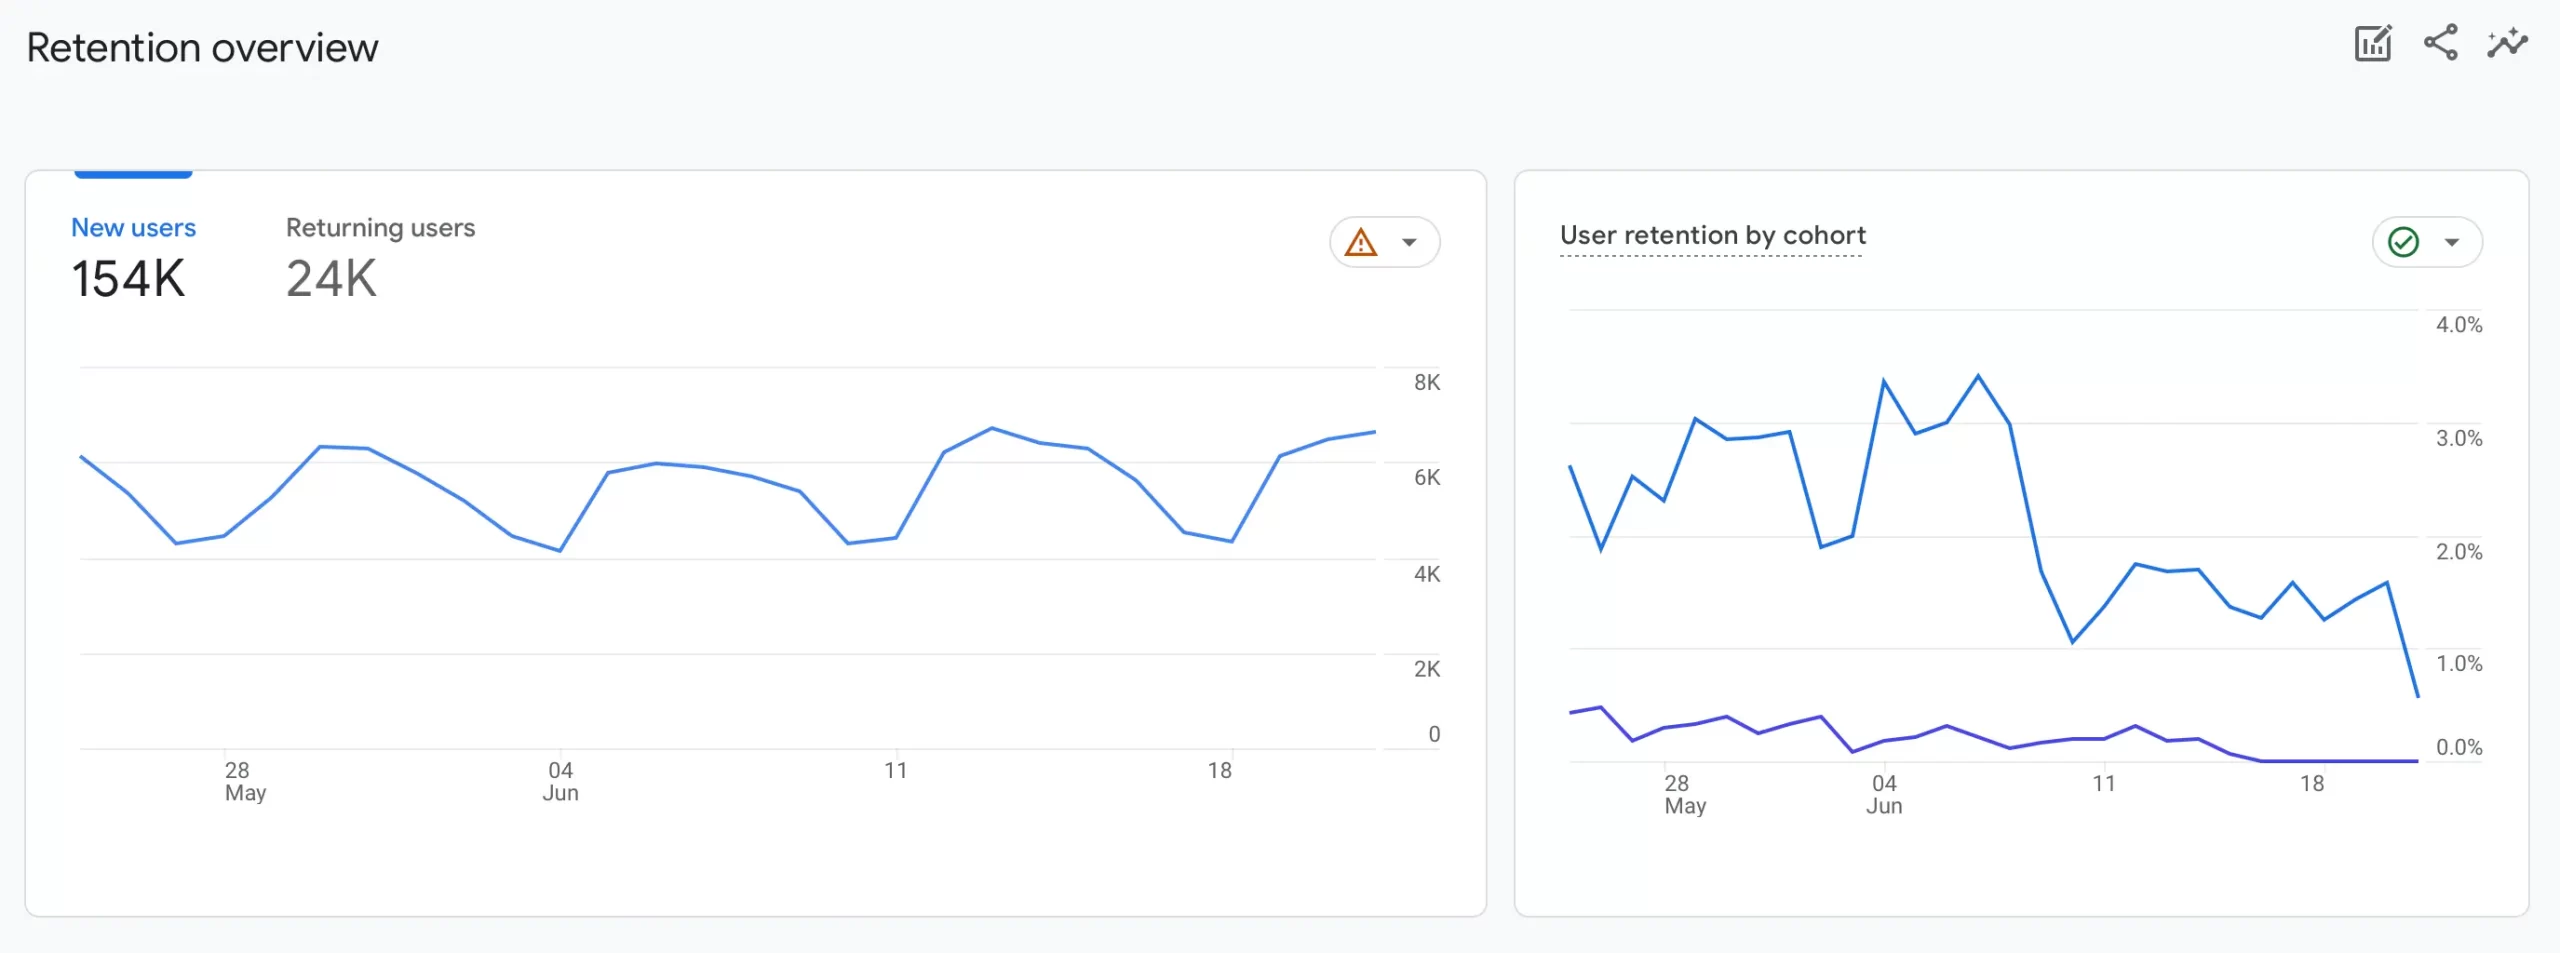
Google Analytics offers an easy way to monitor return visitors. View the Retention Report under Life Cycle to analyze a number of reports comparing new and returning website visitors.
4. Google Keyword Rankings
Google keyword rankings provide an overview of how effectively you’re ranking on the Google SERPS for key terms and phrases. Using keyword ranking statistics, you can monitor your visibility and benchmark your SEO performance against competitors.
Why this metric is important
Keyword ranking is one of the most valuable and straightforward SEO metrics. It provides a clear insight into how successful you’ve optimized a page for a specific keyword.
Monitoring keyword ranking can show you which pages on your website you need to refresh and optimize. It also offers insight into your overall visibility on search engines.
How to measure it
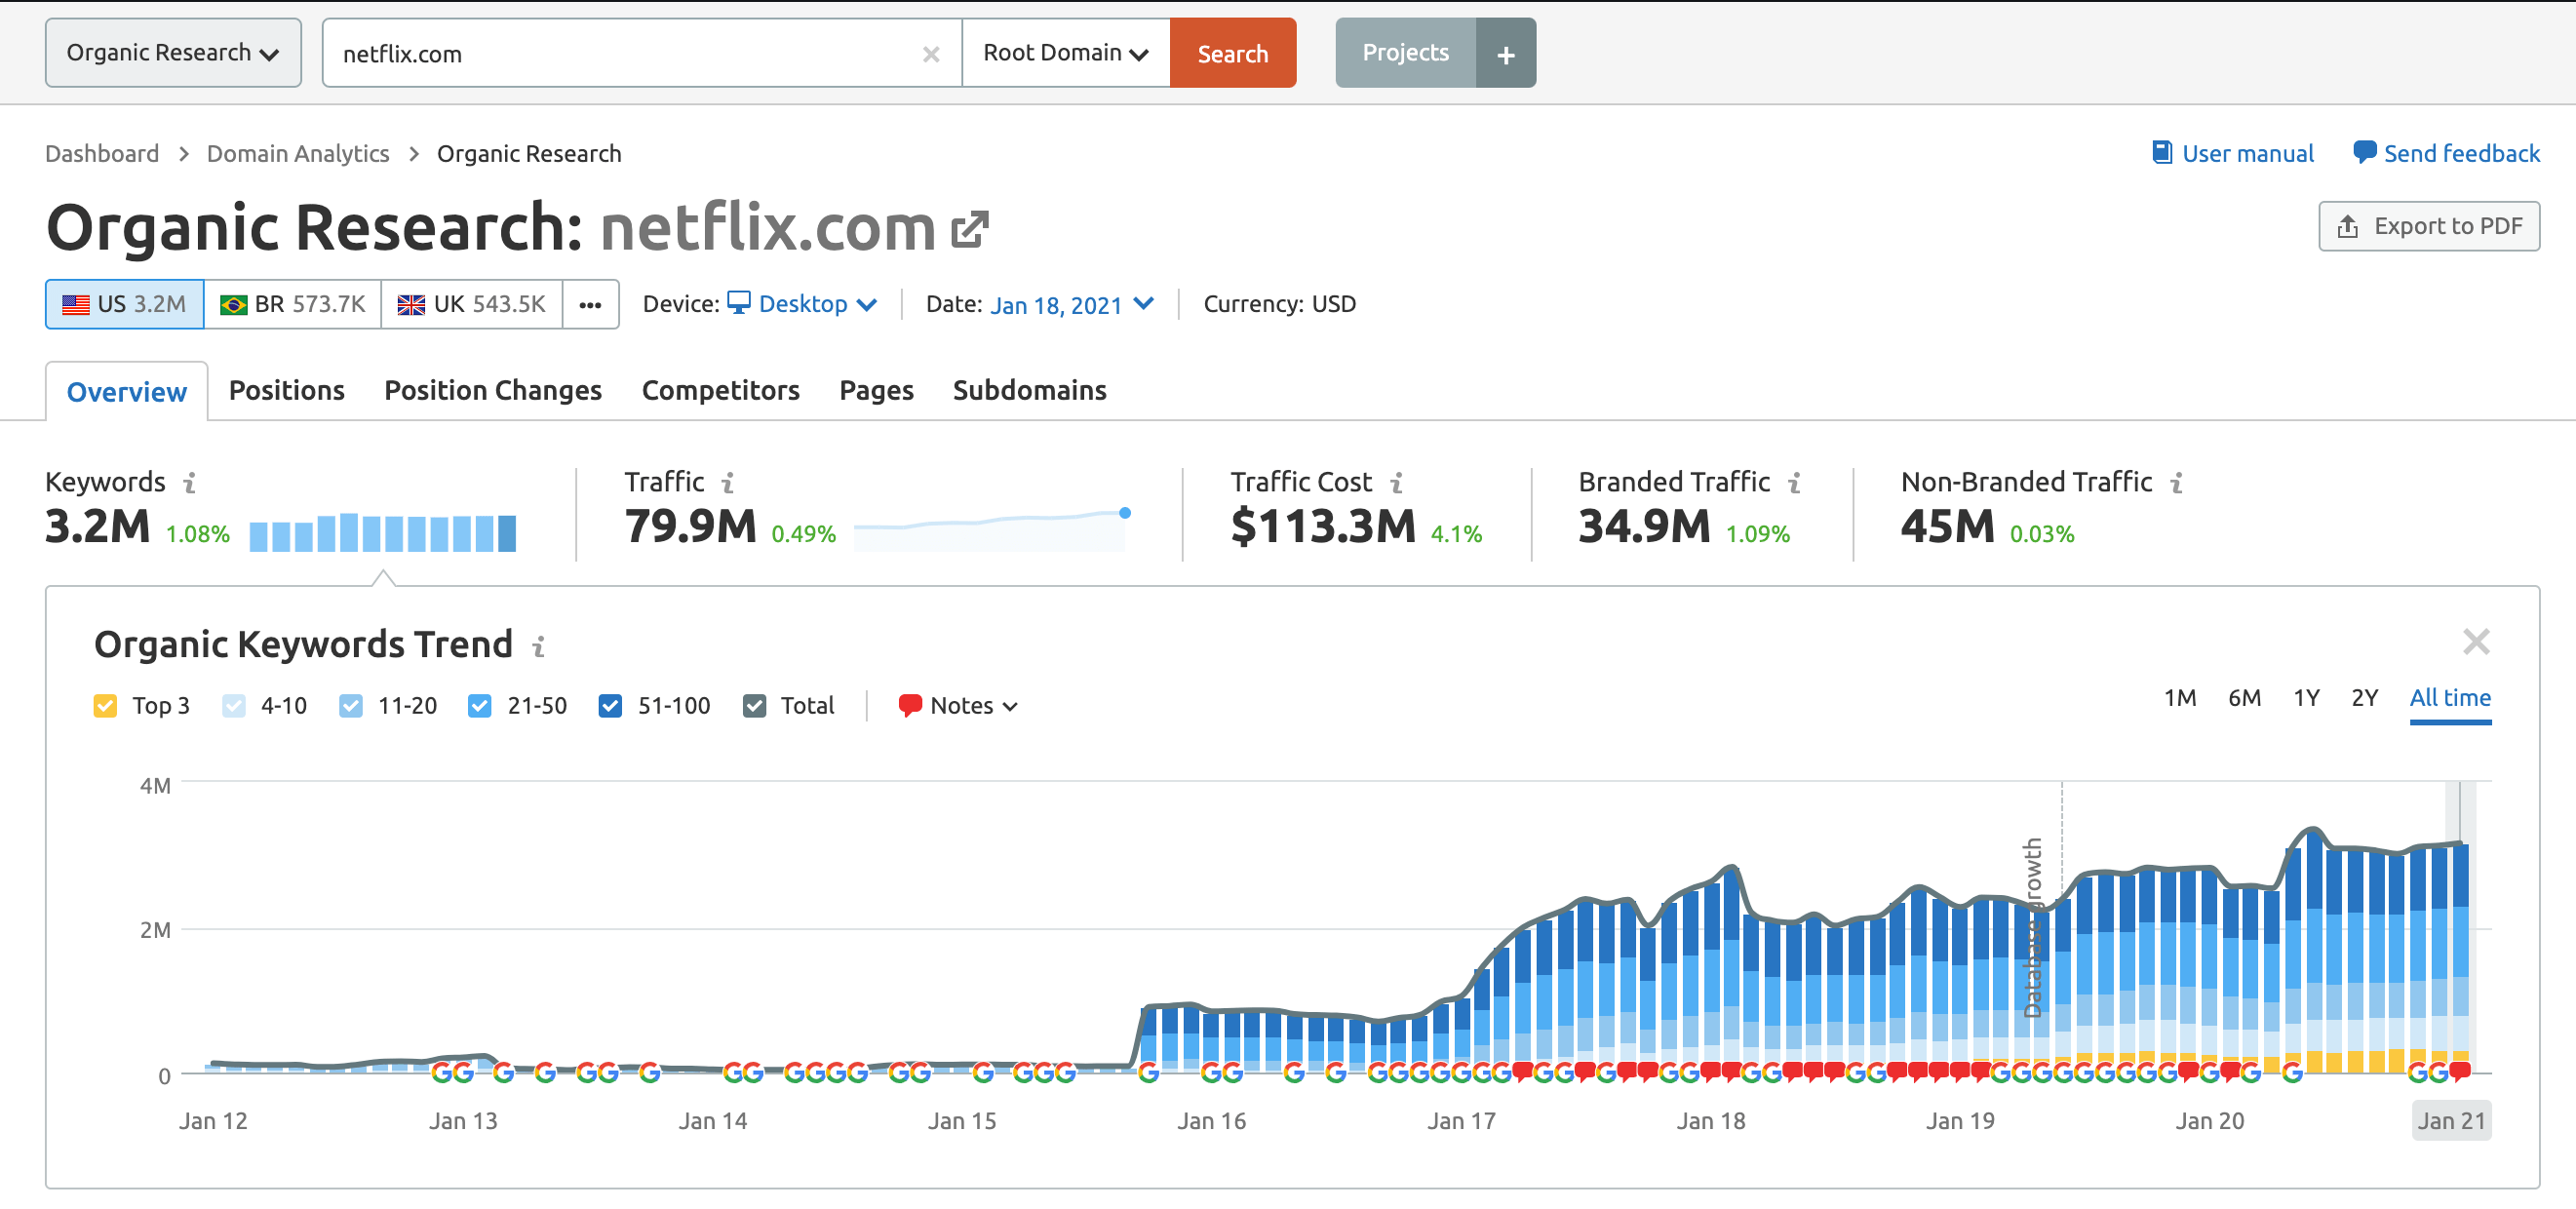
There are various ways to check keyword rankings on Google. The most important are:
- Google Search Console Performance Reports
- Manually Checking Google (With Personalized Search Disabled)
- Using a third-party tool like Semrush, SiteChecker or SERanking
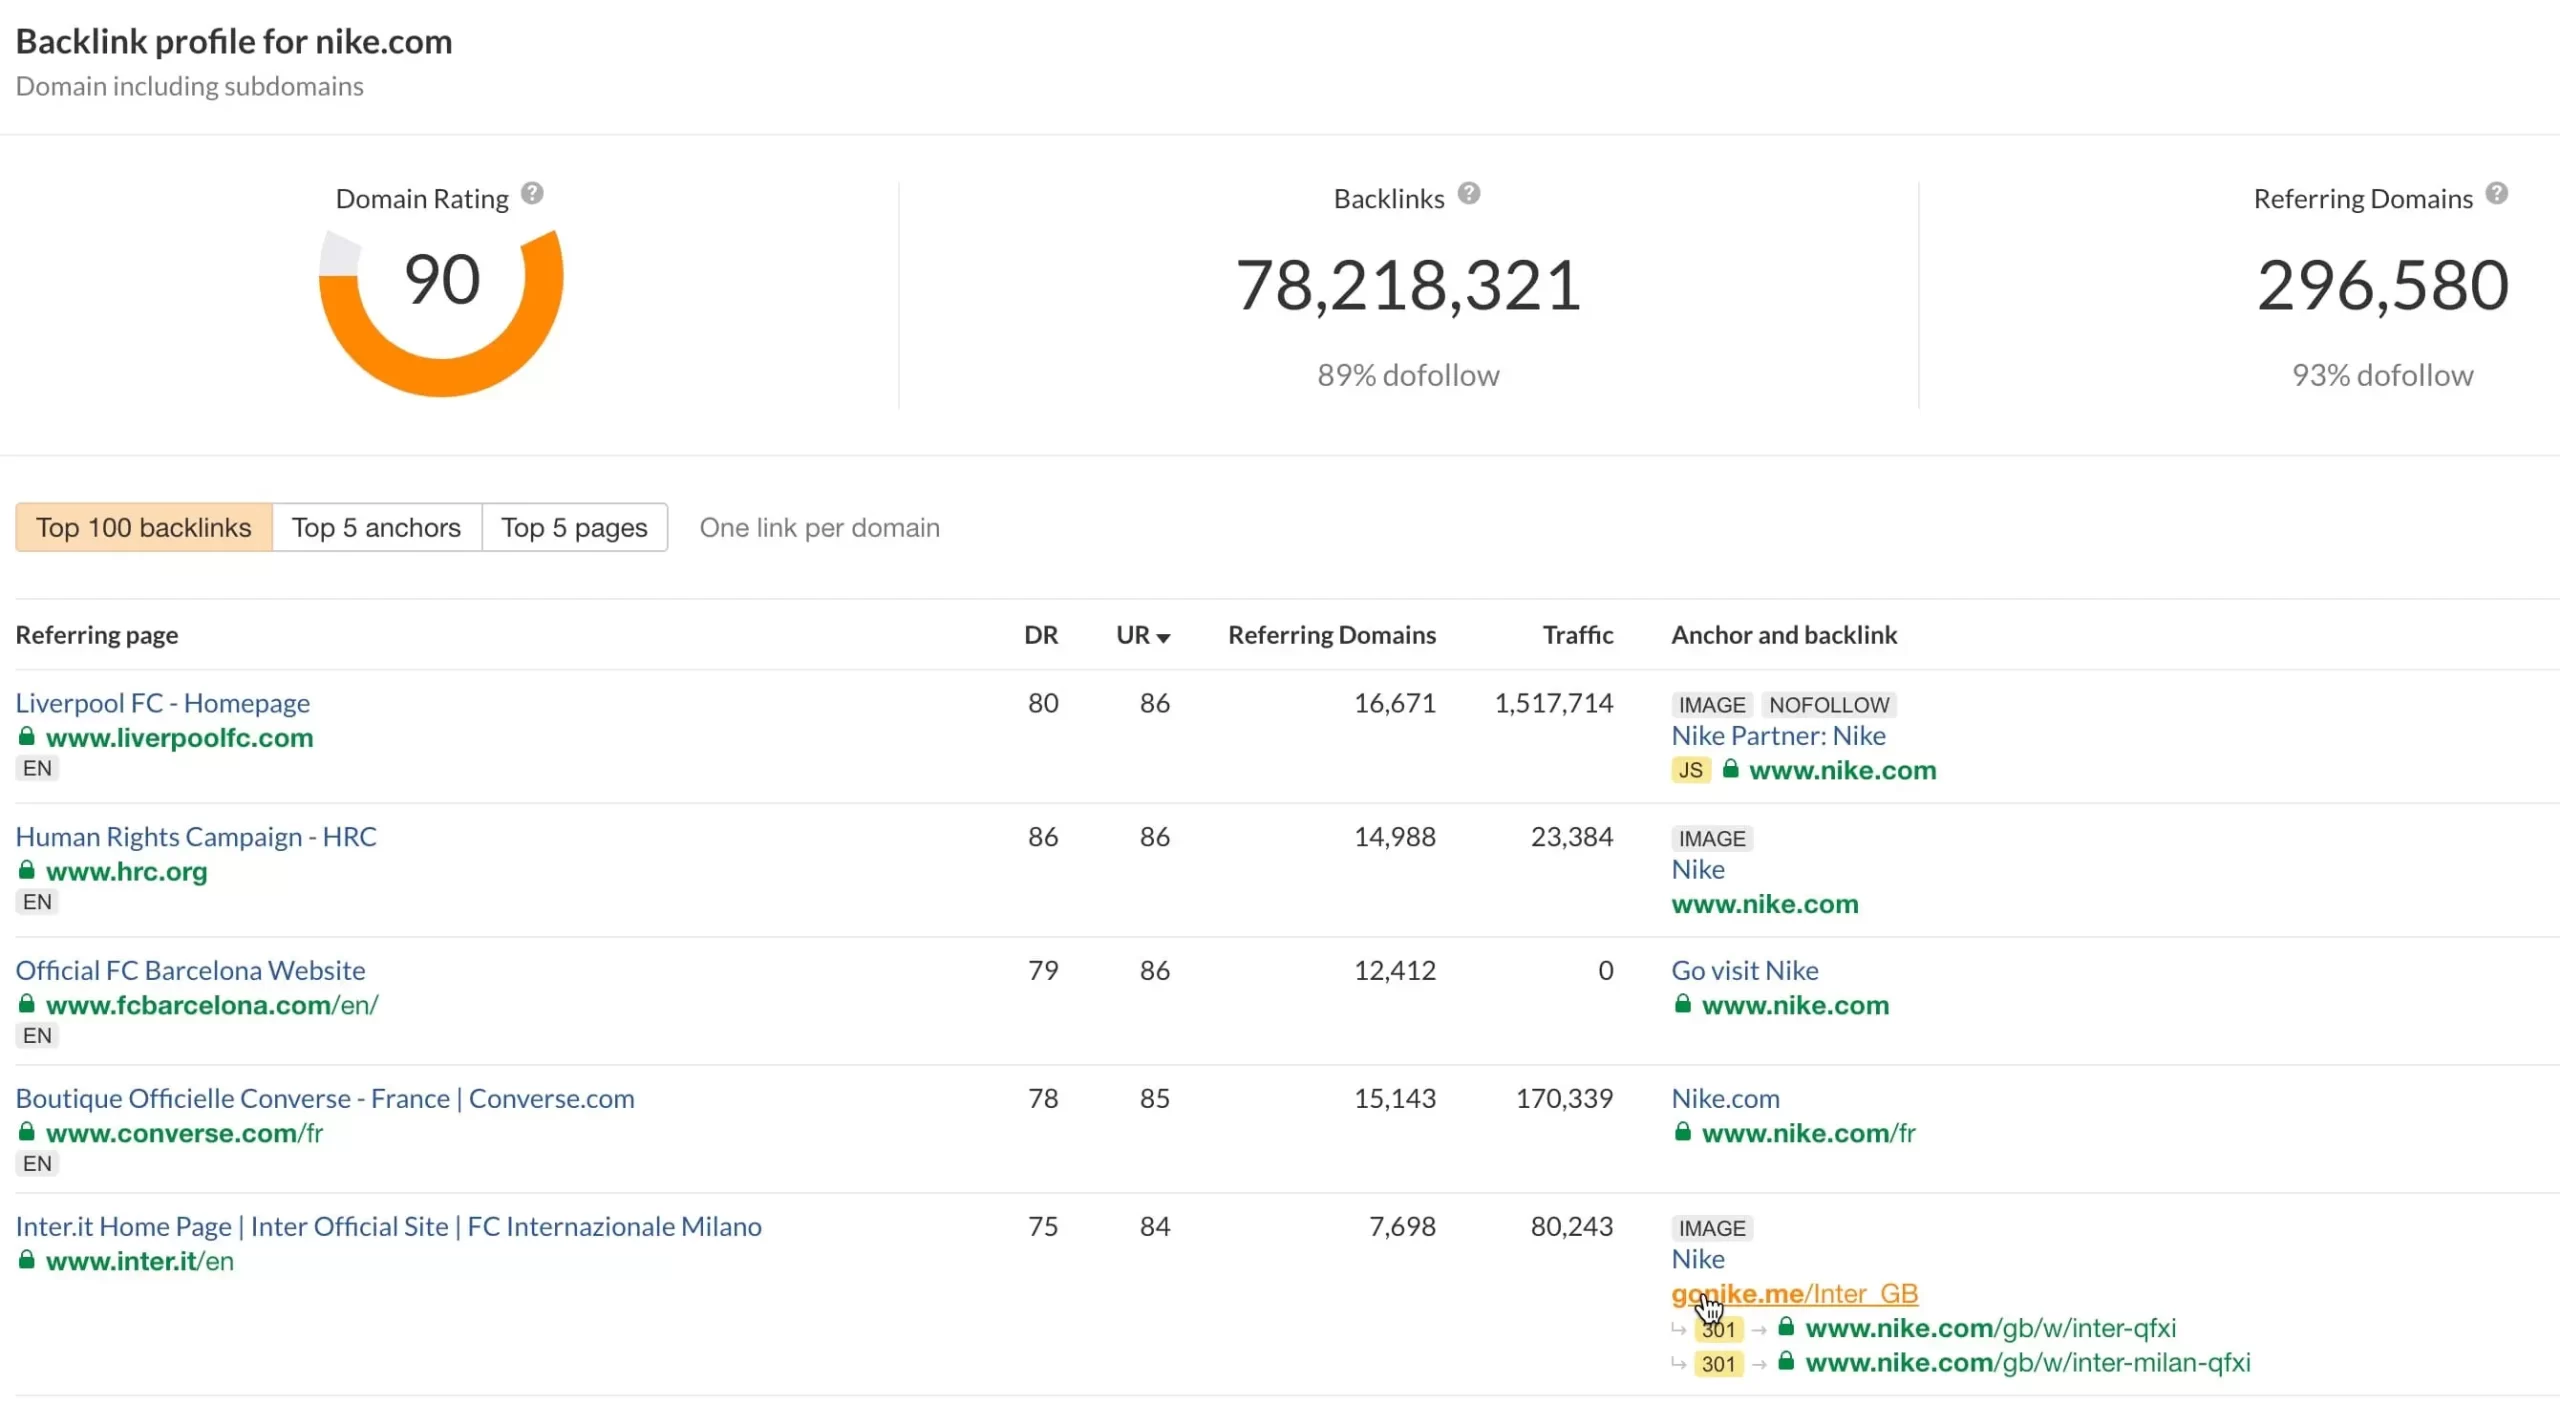
5. Number of Backlinks
Otherwise known as “referring domains”, the number of backlinks is an SEO metric that measures how many domains are linking to your website.
Backlinks show Google that you’re creating high-quality, authoritative, and valuable content trusted by other websites.
Why this metric is important
Monitoring your number of backlinks is an excellent way to track how effective your inbound marketing and content marketing efforts are. Backlinks essentially act as a vote of trust, showing a company’s credibility.
Monitoring your backlinks helps shape your reputation by defining which websites and domains your business should be associated with.
How to measure it
There are a number of free and paid tools you can use to check backlinks and referring domains for any website.
6. Organic CTR (Click-Through-Rate)
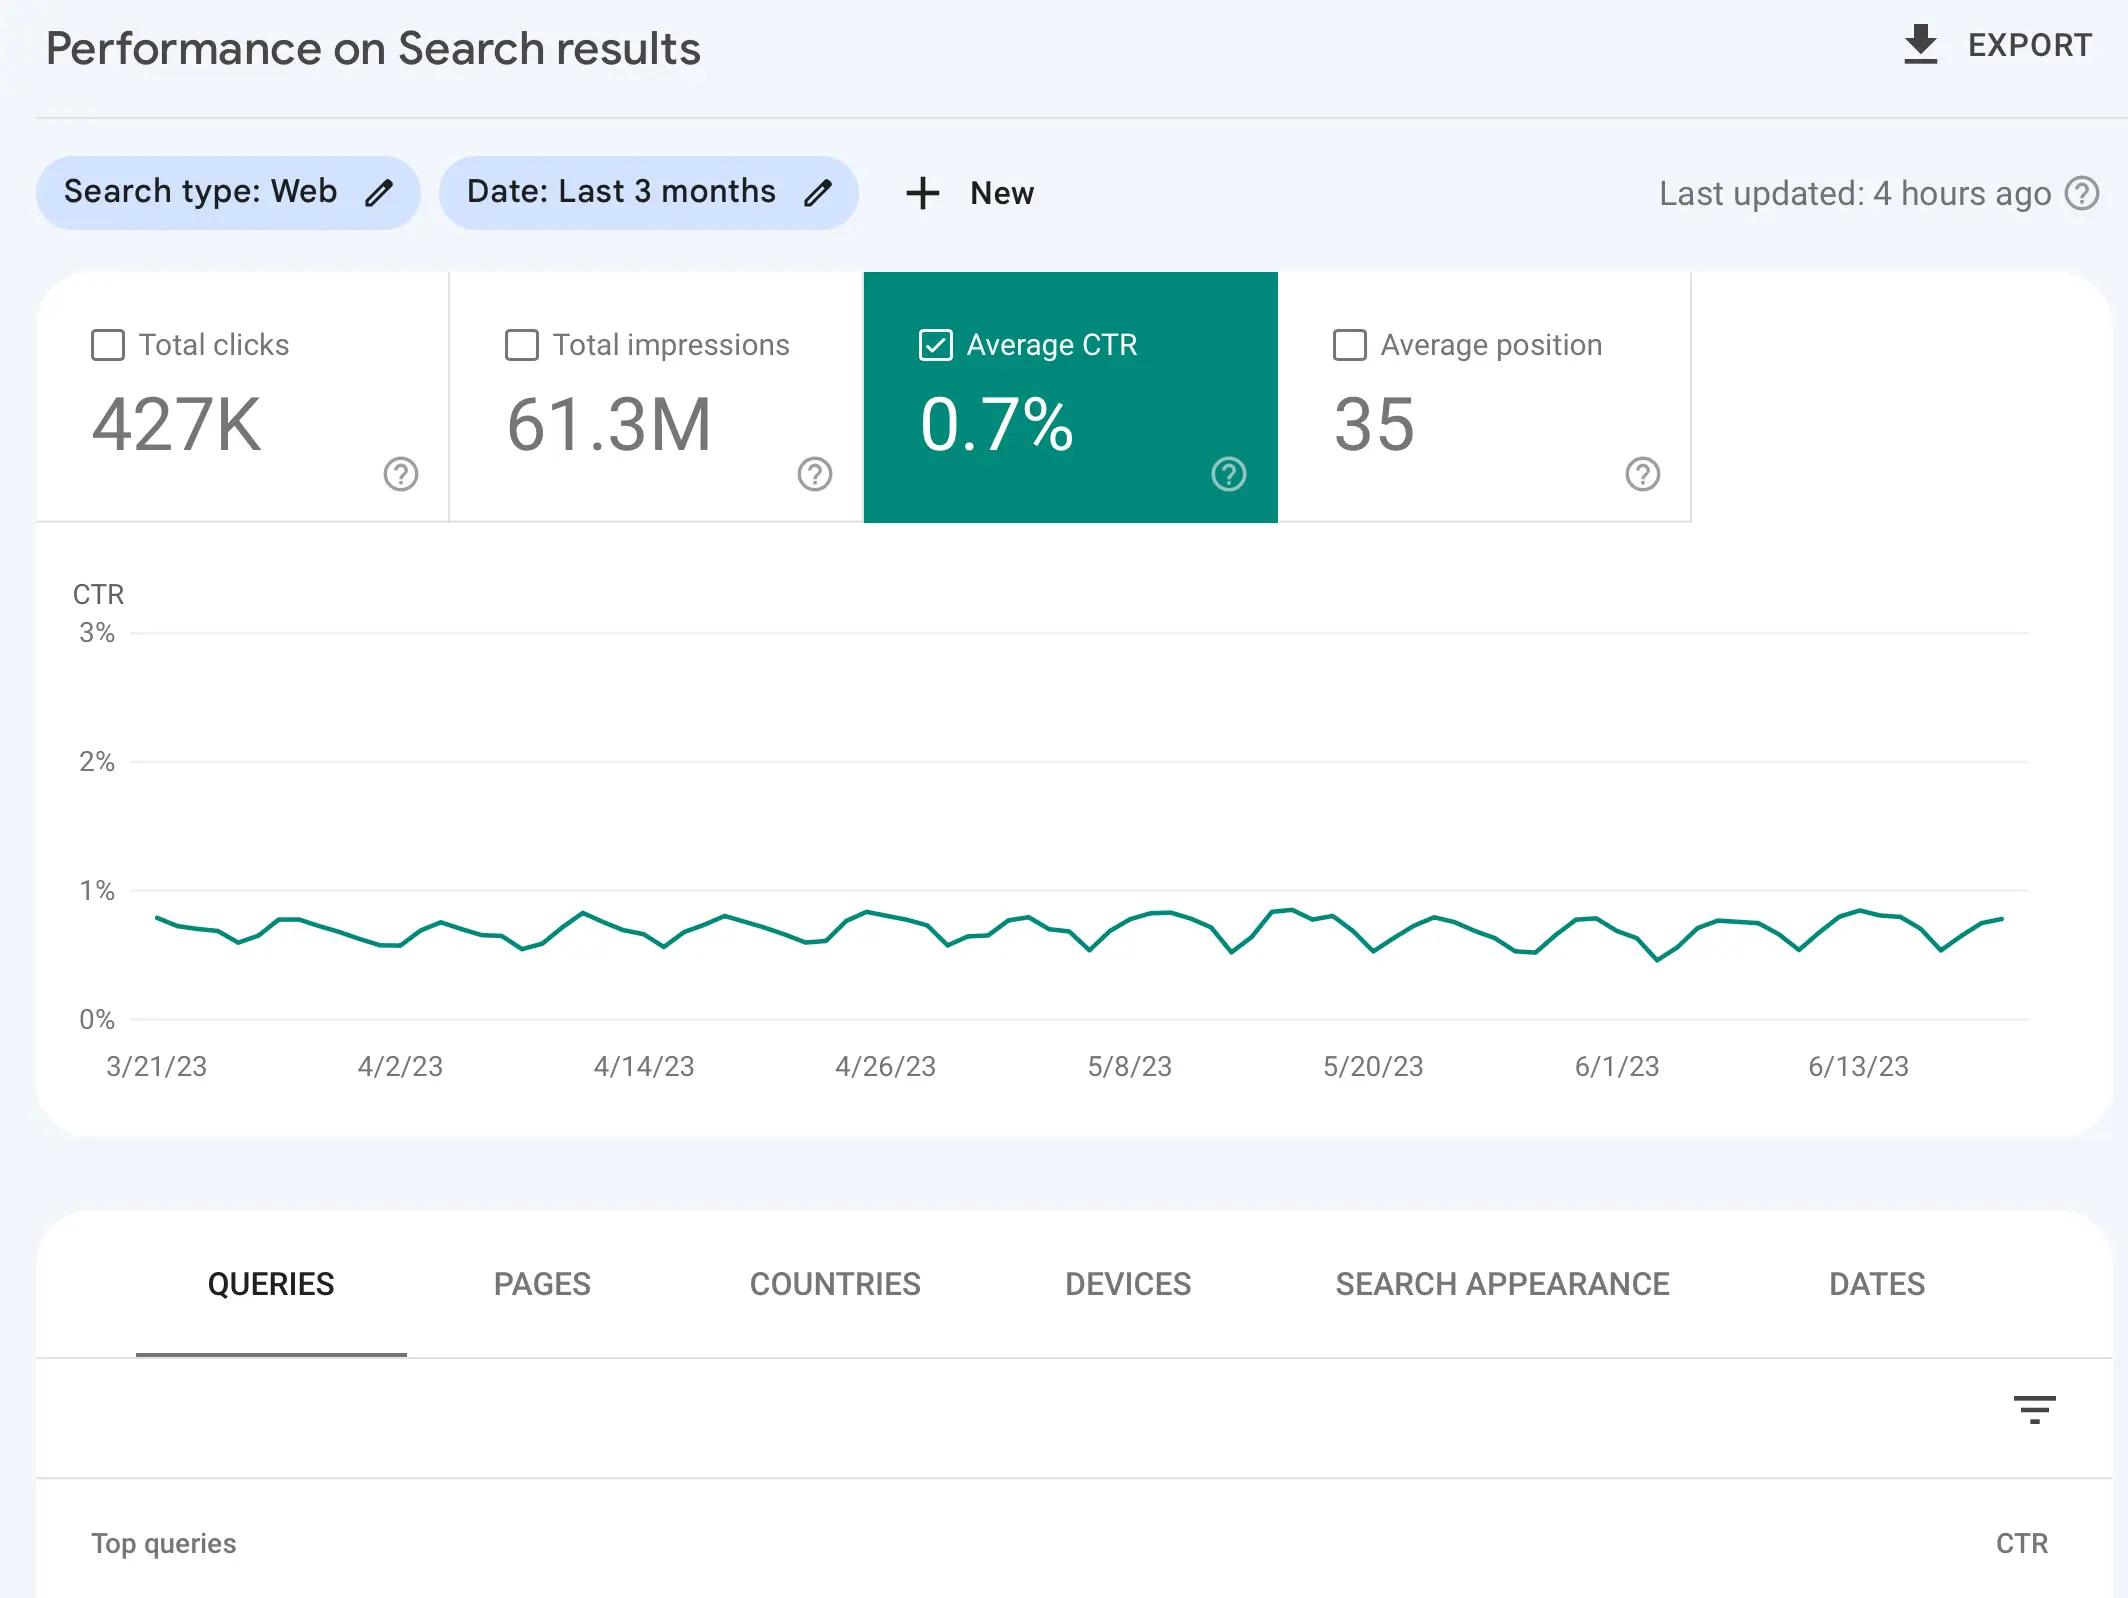
Click-through-rate, or “CTR,” is another valuable metric for digital marketers. It shows the percentage of people who click on your link after seeing it on the search result pages.
This is another tool business leaders can use to understand the value of their SEO strategies.
Why this metric is important
Tracking organic CTR is an excellent way to determine how many people who found your page when searching for a keyword actually clicked on the link.
You can compare this metric with “impressions” to determine whether your web page titles, meta descriptions, and other search factors drive visitors to your site. There’s also a strong correlation between ranking and organic CTR.
The more people click on your website when browsing search engines, the higher your domain score and authority will be. If your CTR is low, this could be a sign you need to update your meta tags and adjust your content for search intent.
How to measure it
The best way to measure your CTR is to view the Search Results Report on Google Search Console and use the Average CTR filter to see the CTR for each keyword.
7. Conversion Rate
Many business owners make the mistake of assuming conversion rates only apply to sales. However, Google Analytics defines a “conversion” as any action taken by a visitor on your website that’s valuable to your business.
This could include someone completing a contact form, signing up for a newsletter, making a purchase, or downloading something.
Why this metric is important
Tracking your conversion rate is crucial when determining the ROI of your marketing campaigns. The higher your conversion rate, the more you know your marketing efforts are convincing customers to take valuable actions with your business.
You can also compare your conversion rate to things like your impression numbers and click-through rate to determine whether people are seeing and visiting your site and not converting. If your conversion rate is low, this could be a sign you need to upgrade your marketing strategy.
How to measure it
Marketers can monitor conversion rates on Google Analytics. You can use different rules to define conversion actions that make sense for your business.
To access this feature, click Conversions from the Google Analytics Admin menu.

8. Sales Pages Visits
While any visitor to your website is valuable, visitors to your sales pages generally have the highest level of intent. Monitoring your sales page visits means tracking how many people visit specific landing pages and product pages on your site.
Why this metric is important
Tracking sales page visits gives you an insight into exactly how many people are interacting with your sales copy and content. Comparing this information to the number of people who visit your website can show you how effective your sales pages are.
You can also use insights into sales page visits to see which of your pages are most valuable, so you can use your marketing budget in the most lucrative areas.
If you’re generating more visits and conversions on a specific page, you can use that page as a template to enhance the ROI of your other website content.
How to measure it
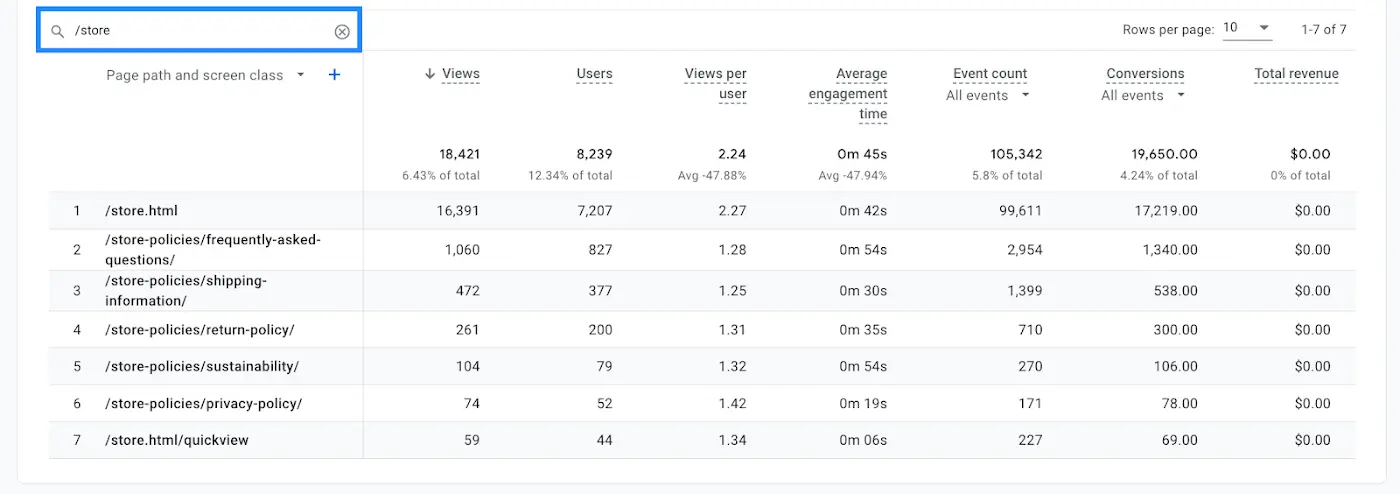
Measuring sales page visits is as simple as diving deeper into your website traffic metrics on Google Analytics. You can view the Pages and Screens Report under Engagement to analyze the performance of specific pages.
9. Bounce Rate
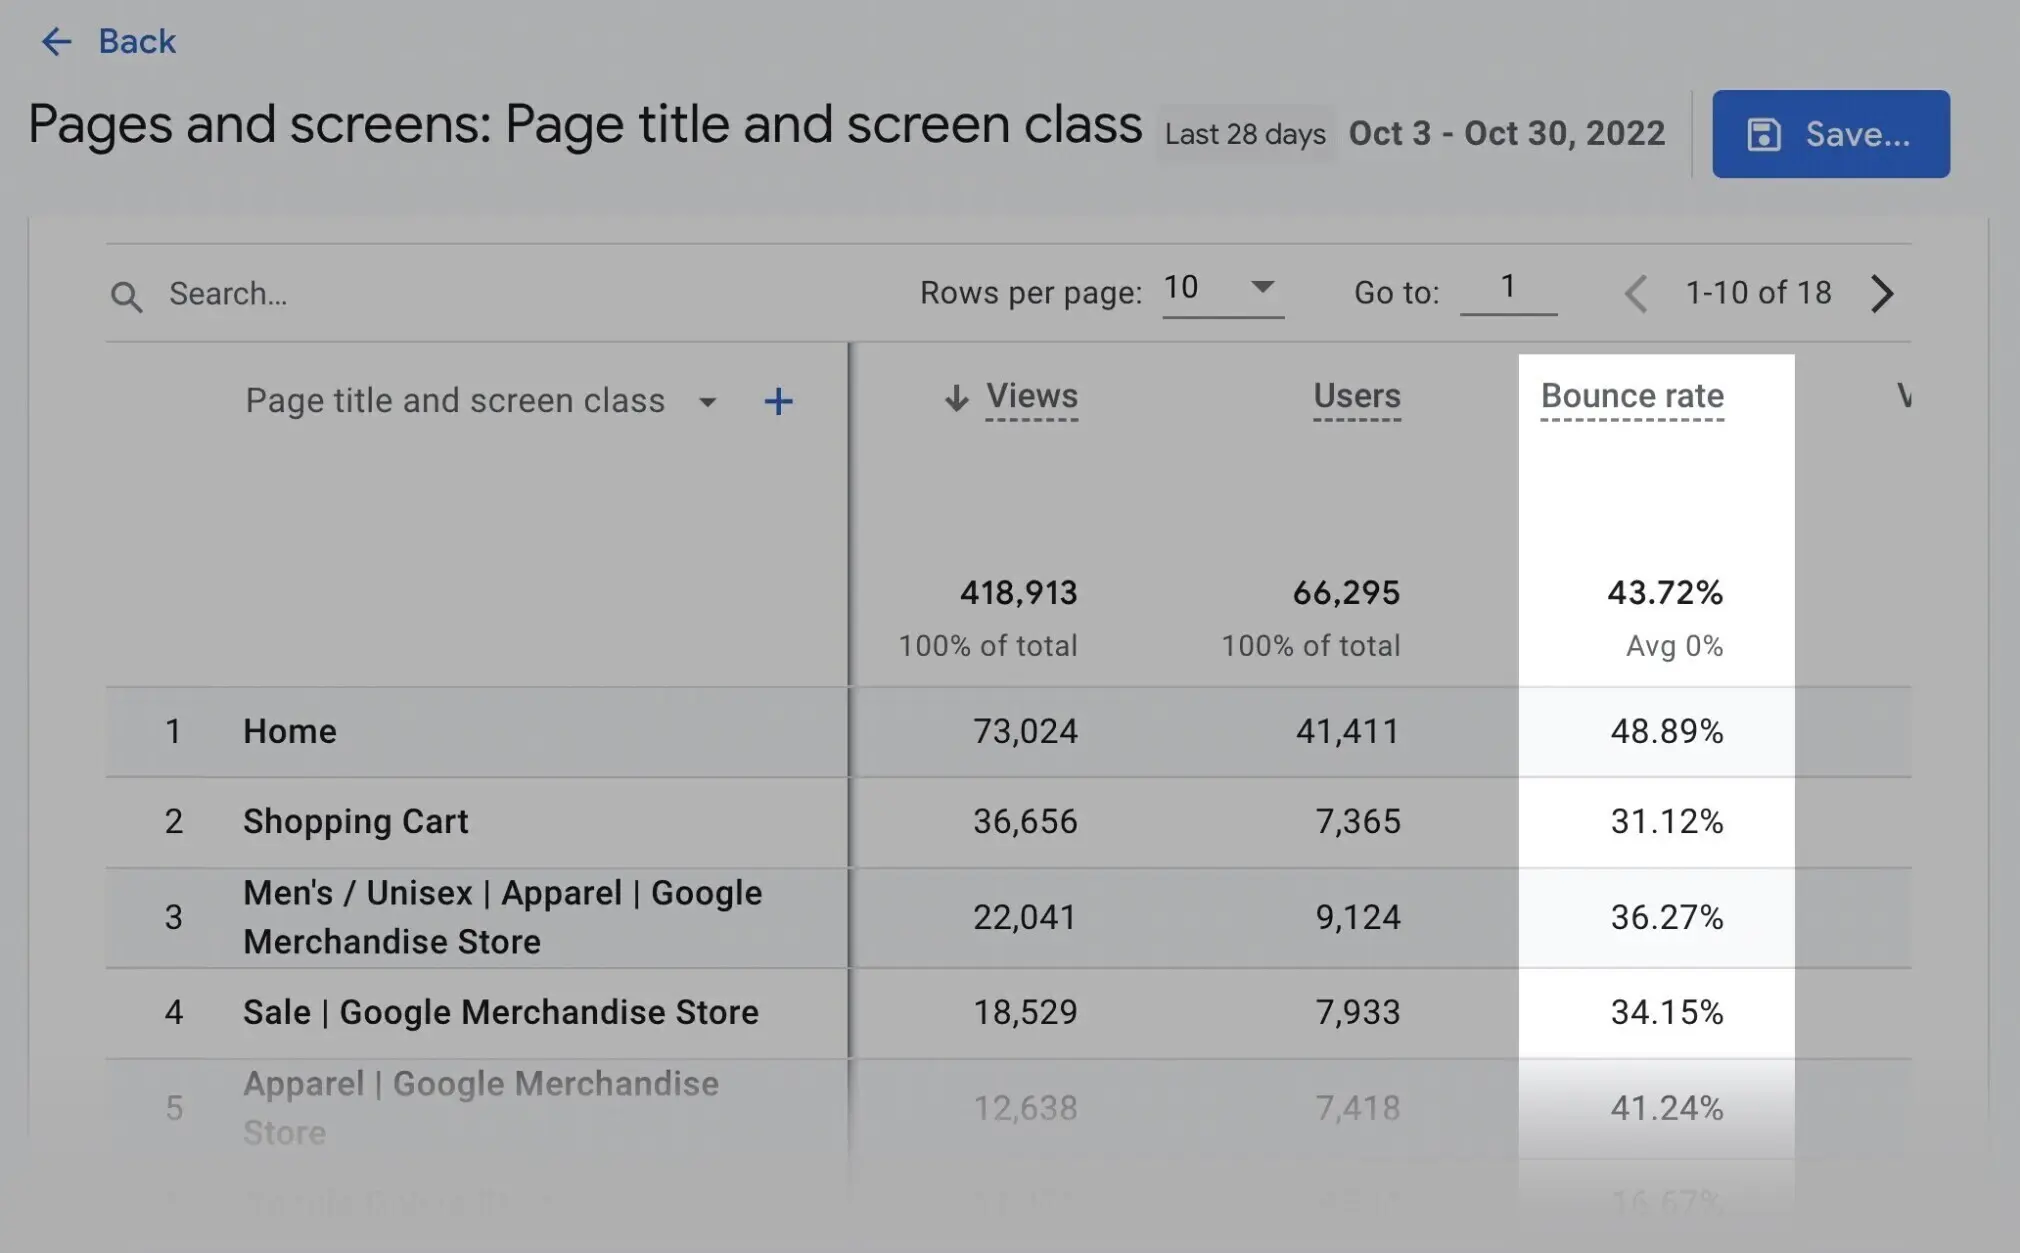
is the metric used to define what percentage of visitors land on your website, then leave without taking any action.
It offers an insight into how many visitors may not get exactly what they need from your website pages.
Why this metric is important
There are a few reasons why bounce rate is important to track. First, if your bounce rate is high, this indicates that your pages aren’t delivering the right value to customers.
You might be targeting the wrong keywords or using the wrong page titles and descriptions.
Bounce rate also affects your Google ranking potential. The higher your bounce rate, the more likely Google sees you as a non-valuable website for the particular search query.
Reducing your bounce rate with more engaging copy, better-targeting strategies, and technical SEO to improve user experience can increase conversions and site authority.
How to measure it
Like many SEO metrics, you can track bounce rate in Google Analytics. To add it to your reports, visit these simple instructions from Google.
10. Ads Impression View
Ads Impression view is a metric that defines the number of people who see your PPC (Pay per click) ads. Though it doesn’t show how many people interact with your ads, it highlights your campaigns’ visibility.
Why this metric is important
Monitoring impressions is an excellent way to start tracking the potential success of your PPC campaigns. You can use this metric to determine the visibility of your ads, which can help you to determine when they need to be optimized.
How to measure it
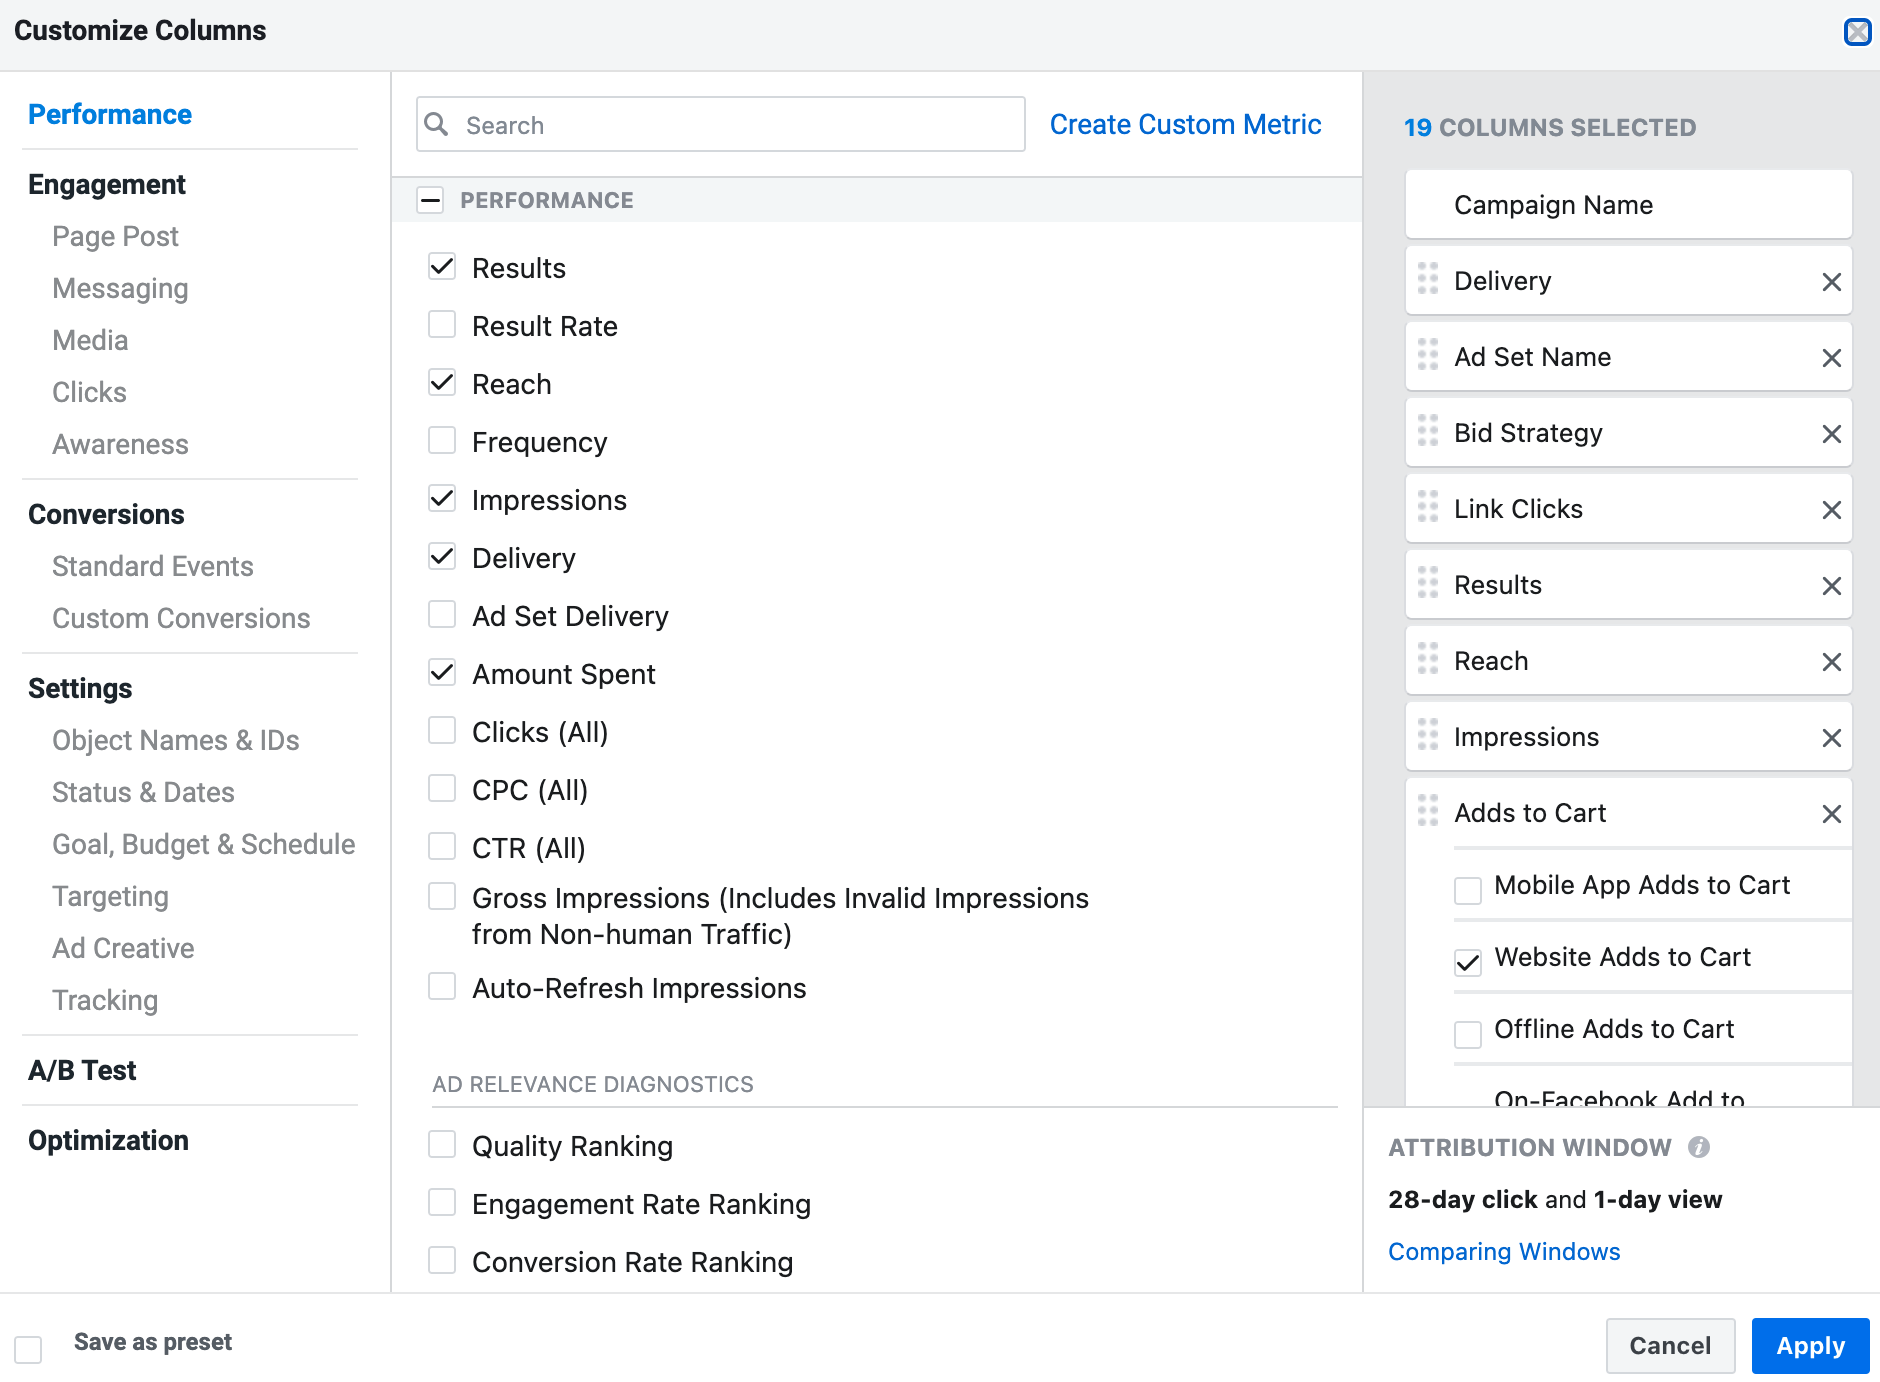
The easiest way to track Ad impressions is to use the reports provided by your advertising platform. In Google ads, ad impressions are shown in all reports.
On Facebook, you can add Impressions by customizing your Facebook Ads reports.
11. Ads Click-Through-Rate (CTR)
Your Ad Click Through Rate, or CTR, highlights how many people are actually clicking on your ads when they see them on channels like Google Search.
This metric provides you with a ratio, based on the number of people who saw your ad, and the number of clicks you earned.
Why this metric is important
Monitoring the click-through-rate for your ads gives you an insight into how effective your ad copy, offers, and campaigns really are in the PPC world.
If your ratio of clicks is low compared to your number of impressions, this indicates something is wrong with your ad.
You may be targeting the wrong keywords or audience, or you may not have the right title, copy, or content in your ad to ensure conversions.
Testing different types of ad copy, offerings, and experimenting with landing page designs can increase your CTR.
The higher your click-through rate, the better your ROI for your PPC campaigns.
How to measure it
This is an important metric provided by all PPC advertising platforms. Look for the CTR column in your reports.
12. Ads Cost-Per-Click (CPC)
CPC, or Cost per Click, is the metric marketers use to determine how much they’re actually spending to drive customers to click on their website with ads. It’s also the term used to refer to how marketers pay for PPC campaigns.
Google Ads and other PPC platforms use CPC to determine the costs of campaigns.
Why this metric is important
Tracking your CPC for each paid ad campaign helps you to determine the ROI of your advertising efforts.
When you know how much you pay to earn an ad click, you can decide whether you’re overspending or underspending on paid campaigns.
Monitoring CPC is also an excellent way to ensure you use your marketing budget effectively. If your CPC is high and your conversion rates are low, this indicates you might need to target different keywords, customers, or channels.
How to measure it
Each PPC platform, including Google Ads, will automatically generate a Cost Per Click value based on various factors. You can calculate your own CPC by dividing the cost of your advertising campaign by the number of clicks you receive.
The lower your CPC, the higher your potential ROI will be for your ad campaigns.
13. Ads Number of Conversions
Tracking your ad conversions is similar to tracking your overall conversion rate. However, in this instance, you focus specifically on the conversions you receive from your ad campaigns. Once again, a conversion can be anything from a purchase to signing up for a newsletter.
Why this metric is important
Ad conversion rate is the cornerstone of any PPC marketing strategy. If you’re not earning a healthy conversion rate, you’re paying for clicks that aren’t generating revenue or opportunities. Conversion rates can also provide insights into the quality of your ads.
Monitoring your conversion rate against your click-through rate can show you if your landing pages aren’t effective enough. If your conversion rate is low, you may need to ask whether your ad copy is misleading or targeting the wrong audience.
How to measure it
Google Ads, and many other PPC platforms offer tools to help you monitor your conversion rate. On Google Ads, you can click into the “Tools” menu”, and click on “Conversions”. Here, you can decide which conversion actions you want to track on your site.
You can set up different conversion actions for each behavior you want to track, from sales, to calls and customer requests. You can also set multiple conversion actions for each conversion source.

14. Ads Cost Per Conversion
Ads cost per conversion, or “is the metric used in online advertising to track the amount you pay for an ad, related to the success of achieving the goals of the advertisement. It’s one of the easiest ways to understand the ROI of your campaigns.
Why this metric is important
Your Ads conversion rate shows you how effective your ads are at driving results. If your cost per conversion is too high, this could indicate that your ads aren’t delivering a good return on investment. You might be targeting the wrong audience, or using the wrong ad copy.
A lower Cost per conversion rate shows that you’re using the right strategies to convert your audience. It can also offer insight into where you should be focusing your marketing budget if you have limited money to invest in paid ads.
How to measure it
You can track the cost per conversion on your campaigns by dividing the total cost for your ads by the number of conversions. For instance, if you spend $1000 on an ad campaign and earn 100 new customers, your cost per conversion would be $10.
15. Social Media Followers
Website traffic isn’t the only metric worth monitoring if you’re tracking the visibility of your marketing campaigns and growing brand awareness.
Social Media follower rate, or “audience growth rate,” measures how many followers you get on social media channels within a specific period of time.
Why this metric is important
Social media follower rate is an excellent tool for monitoring your growing social presence and audience engagement. This metric measures your new followers as a percentage of your total audience, so you can see how rapidly you’re growing.
Tracking your social media followers can help you define whether your organic social media marketing efforts and paid campaigns drive audience engagement.
You can also monitor how many followers you lose in a specific time period, to see whether your new followers outweigh your lost contacts.
How to measure it
The easiest way to measure social media followers is to simply track the number of new followers you earn on a social media site within a specific time period. You can get your growth rate by comparing that number to your overall follower count.
There are social media management tools that can help to monitor this metric for you, such as Social Pilot or HootSuite.
16. Social Media Engagement Metrics
Earning followers is just one form of engagement on social media. Examining your wider social media engagement metrics can help you to see how many people are actively interacting with your brand, through likes, shares, follows, and other actions.
Why this metric is important
Monitoring social media engagement rate is important for a few reasons. A high level of engagement indicates you have a strong connection with the right target audience. It shows you’re connecting with people who are interested in your company.
Additionally, engagement is a ranking signal for virtually all social media platforms. If people are engaging with your content, the algorithms will see the content as more interesting and valuable, meaning you’re more likely to have your posts prioritized on news feeds.
How to measure it
Measuring the social media engagement rate starts with defining which types of engagement you’re going to monitor, such as likes, comments, shares, and followers. Tools like Sprout Social and Buffer can provide insights into your engagement rate over time, with visual graphs to show whether your rate is rising or falling.
17. Email Subscribers
Email is still one of the best ways to connect with and nurture your target audience. Monitoring your email subscribers shows you how many people you have on your contact list to nurture, and convert into repeat customers. Often, monitoring email subscribers also means tracking your number of unsubscribes too.
Why this metric is important
Monitoring email subscribers gives you an excellent way to determine how many people are actively signing up for your newsletters and responding to your pop-ups or landing pages. The more subscribers you earn over time, the more leads you’ll have to nurture.
Examining your number of new email subscribers compared to your unsubscribe rate can also show you whether customers might be unsatisfied with the emails you produce.
A high unsubscribe rate and a low subscriber rate indicate you need to enhance your content.
How to measure it
You can monitor your number of email subscribers manually by simply paying attention to the number of people who sign up for your newsletter. However, most email marketing automation tools will make this process easier, by showing your subscriber numbers in a visual format, with graphs and charts.
18. Email Open Rate
A high number of email subscribers will only benefit your business if customers are opening and interacting with your messages. Your email open rate shows you how many customers are actually clicking on your emails.
Why this metric is important
Monitoring email open rate is an excellent way to determine whether you’re effectively convincing people to read your marketing messages and newsletters. If your email subscriber rate is high, but your open rate is low, this suggests that your campaigns aren’t engaging your customers.
You may need to consider experimenting with different subject lines and “from” names in your email marketing strategies to increase your open rates. You can also compare your open rates over time to track the progress of your campaigns.
How to measure it
Once again, most email marketing automation tools like CampaignMonitor and MailChimp will allow you to track your open rate over a set period of time. They’ll also offer insights into how many people see your emails, so you can compare your delivery rate to the number of people opening your emails.
19. Email Click-Through-Rate
Email click-through rate looks at the percentage of email recipients who not only open your email, but click on one or more of the links contained in the message. It’s a way of monitoring how many people are acting based on your email content.
Why this metric is important
Monitoring email clickthrough rate is crucial for any digital marketer investing in email content. It allows you to see whether your email campaigns are effective at encouraging customers to visit your websites, landing pages, and other locations.
You can compare your email click-through rate to your open rate to learn more about the quality of your campaigns. If your open rate is high, but your click-through rate is low, this indicates it’s the copy in your email, not the subject line that needs optimizing.
How to measure it
The simple formula for calculating email click through rate is to divide the number of people who clicked on an email by the number of emails you delivered. Most email marketing tools will allow you to calculate this number automatically.
You can also use A/B testing and other tools on an email marketing platform to determine how different copy, CTA buttons, and offers influence your click-through rate.
20. Customer Acquisition Cost (CAC)
Customer acquisition cost, or “Cost Per Acquisition” is an overall metric used for virtually every type of advertising. With your Customer Acquisition Cost, you determine exactly how much you pay to convince a lead or visitor to become a customer with your campaigns.
Why this metric is important
Customer acquisition cost is important because it helps to define the actual ROI of your campaigns. By calculating customer acquisition cost, you can determine exactly how much you spend to attract and convert customers. Once you have that number, you can compare it to the average lifetime value of each customers.
Comparing these two numbers will show you whether you’re spending too much on the wrong marketing campaigns, and not getting enough revenue in return.
How to measure it
The easiest way to calculate customer acquisition cost is with a little math. You’ll need to divide all of your sales and marketing costs in a specific period, by the number of customers you gain within that period. For instance, if you spend $100 on marketing in a week, and receive 10 customers, the CAC would be $10.
You can then combine this number to your customer’s average value. For instance, if each new customer spends $20, then you would have a positive CAC ratio.
